About Statistics in Switch
Switch allows you to collect information on how long jobs reside in certain folders or states while being moved along a flow. This can be useful to identify performance bottlenecks.
- Folder statistics calculate the average time jobs reside in a folder for which statistics have been enabled.
- State statistics calculate the average time jobs reside in a particular state. A state can be attached to a job folder via the Folder property "Attach job state", and allows you to combine information about several folders having the same function, for example "coming in" or "in progress".
Statistics are not limited to a single flow: Switch combines all statistics-enabled folders from all active flows in a single set of statistics. If two or more folders (used in different flows) have the same name, the statistics for these folders are combined in one single entry.
Setting up statistics
- To gather Folder statistics, you must enable the Show in statistics property of the folder concerned.
- To gather State statistics, you must fill out the Attach job state property of the folder concerned.
You can only gather statistics for a folder that has outgoing connections. Folders at the end of the flow do not have the Show in statistics and Attach job state property, because Switch has no control over the time the jobs reside in such a folder.
Remark
- In case of Folder statistics, the calculated time is the queuing time between the moment the job is detected and the the moment the job is handed over for processing on an outgoing connection.
- In case of State statistics, this is the queuing and processing time between
two different job states. Note that, due to the fact that statistics are only
logged when the job state changes, it is necessary to introduce an extra dummy
state (which will never be logged) at the end of the last flow element of interest
or just before the last folder of the flow (as the last folder has no Attach
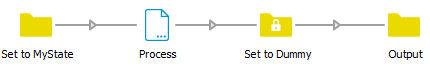
job state property, hence the job state cannot change). In the following
example, the time spent in the "Set to MyState" includes the queuing time in the first
folder and the processing time in the generic application ("Process"). The second folder
was introduced to change the job state to a dummy value.
Note: The time during which a job is blocked (e.g. because the relevant flow was not active or Switch was not running) is also included in the statistics.
Displaying statistics
To display the Statistics pane, click  in the Switch toolbar or go to .
You can display up to three statistics panes (by clicking or Statistics 3) at the same time. This allows you to display a second and third set of statistics (e.g. sorted in a different way).
For more information about this pane, refer to Statistics pane.
Resetting statistics
To remove the collected information, i.e. to set all counters to zero, go to . Switch will start gathering statistics from scratch.