The Statistics pane allows you to display the average time jobs reside in a particular folder or state while being moved along a flow.
You can open this pane, by clicking  in the Switch toolbar, or by
selecting from the menu at the top of the application.
in the Switch toolbar, or by
selecting from the menu at the top of the application.
in the Switch toolbar, or by
selecting from the menu at the top of the application. Important: Do not forget
to refresh the statistics ( by selecting ), to make sure the most recent information is displayed.
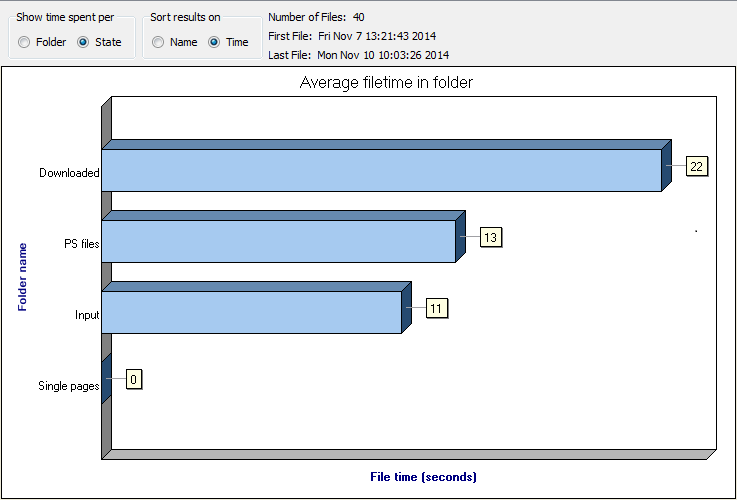
The chart gives an overview of the folders or states (on the y-axis) and the average time in seconds (on the x-axis) jobs spent in each of them.
You can determine what is shown by changing the options in the Show time spent
per and Sort results on sections:
- Show time spent per Folder/State determines what's shown in the chart below; either the average time spent in a particular (statistics-enabled) Folder or the time spent in a particular State.
- Sort results on determines how the information in the chart is sorted: based on the Name of the folder/state (alphabetically), or the Time (decreasing).
In the top right corner of the pane, you can see the number of files that have been processed,
and the date and time the first and last file were processed.
For more information, see Viewing statistics.