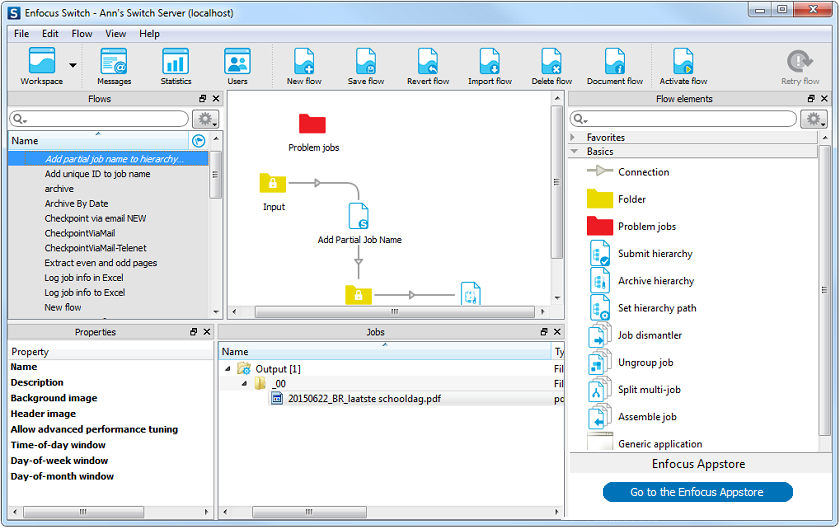
When the Switch Designer is launched, it displays the main window called the workspace, shown here in its default configuration (design view):
Toolbar
The toolbar is the strip at the top of the workspace offering a number of tool buttons.
See Toolbar for more details.
Panes and views
The workspace contains a number of panes which can be manipulated as distinct entities (show, hide, resize, move, ...). Examples include the Flows pane, the Flow elements pane, and the Properties pane.
The central area that displays a flow design is called the canvas; it is a special pane because it has no title bar and it can't be moved from its central position.
One or more panes (optionally including the canvas) combine to make up a workspace configuration called a view. The currently displayed view is selected by pressing one of the buttons in the leftmost section of the toolbar.
Configuring the workspace
The workspace offers a number of panes that are displayed in a number of pre-configured views. Each of the views can be configured at will to display an arbitrary combination of panes. The contents of a pane persists across views (i.e. the different views display the same instance of the pane rather than different copies).
Panes can be shown or hidden by choosing the corresponding item in the menu. Panes can be resized by dragging the separators between them, they can be rearranged next to one another or overlaid as tabs by dragging their title bar, and they can be undocked as a floating pane. All configuration settings are persistent across sessions.
The currently displayed view can be returned to its pre-configured settings by selecting .
Views
The Workspace offers the following views. The intended function is only a recommendation, since the user can re-configure the views at will.
|
Tool button |
View name |
Intended function |
|---|---|---|
 |
Design |
Design a flow |
 |
Test |
Test-run a flow |
 |
Run |
Run a flow in production |
 |
Messages |
View and export log messages |
 |
Statistics |
View statistics |
 |
Users |
Manage users/groups and their access rights |
Panes
The workspace offers the following panes, which can be combined at will in the different views.
|
Pane |
Description |
|---|---|
| Dashboard |
Displays status information on problem jobs or processes, as reported by the Switch server |
|
Lists the icons representing flow elements that can be dragged onto the canvas |
|
|
Serves to view and explore the contents of flow element backing folders (i.e. mostly jobs) Can also be used to view the contents of an arbitrary folder in the file system, but this is not a primary function |
|
|
Lists all flows |
|
|
Displays progress information for tasks currently being executed by the Switch server |
|
|
Displays the properties of the currently selected flow or flow element |
|
|
Displays statistics about job execution by the Switch server |
|
|
Statistics 2, 3 |
Extra statistics panes that may be configured to display a different set of statistics. |
| Client Activity | Allows monitoring SwitchClient connections. (only shown if Job client type is set to 'Legacy'; see Switch preferences: Internal communication.) |
| Client Connections | Shows which SwitchClients are currently connected. (only shown if Job client type is set to 'Legacy'; see Switch preferences: Internal communication.) |
| Job Information | Displays the number of jobs waiting to be processed by each flow element. |
| Health Indicator | Monitors the internal communication processes within Switch. |
| Users pane | Allows managing user names, passwords and access rights |